This post is inspired by my friend Ben’s post of the same name about his experience putting up posters at a different school. Like me, he decided to totally over-engineer the crap out of these poor pieces of paper.
75grand is a collection of resources for students at Macalester College that I created as an alternative to the college’s clunky 1600grand. To promote the site, I designed posters to place all around the school, and decided to have some fun with it.

My goal was to make something that would stand out in its minimalism and pique students’ interest. Thanks to Macalester’s free color printing, I churned out a hundred posters and taped them up throughout campus.
All your data are belong to me
In Ben’s post, he mentions how “[i]t would’ve been really cool for me to generate a different QR code for every poster…that way, I could identify which poster locations were the most effective.” What a wonderful idea! Before I dive into the logistical details, let’s crunch the data.
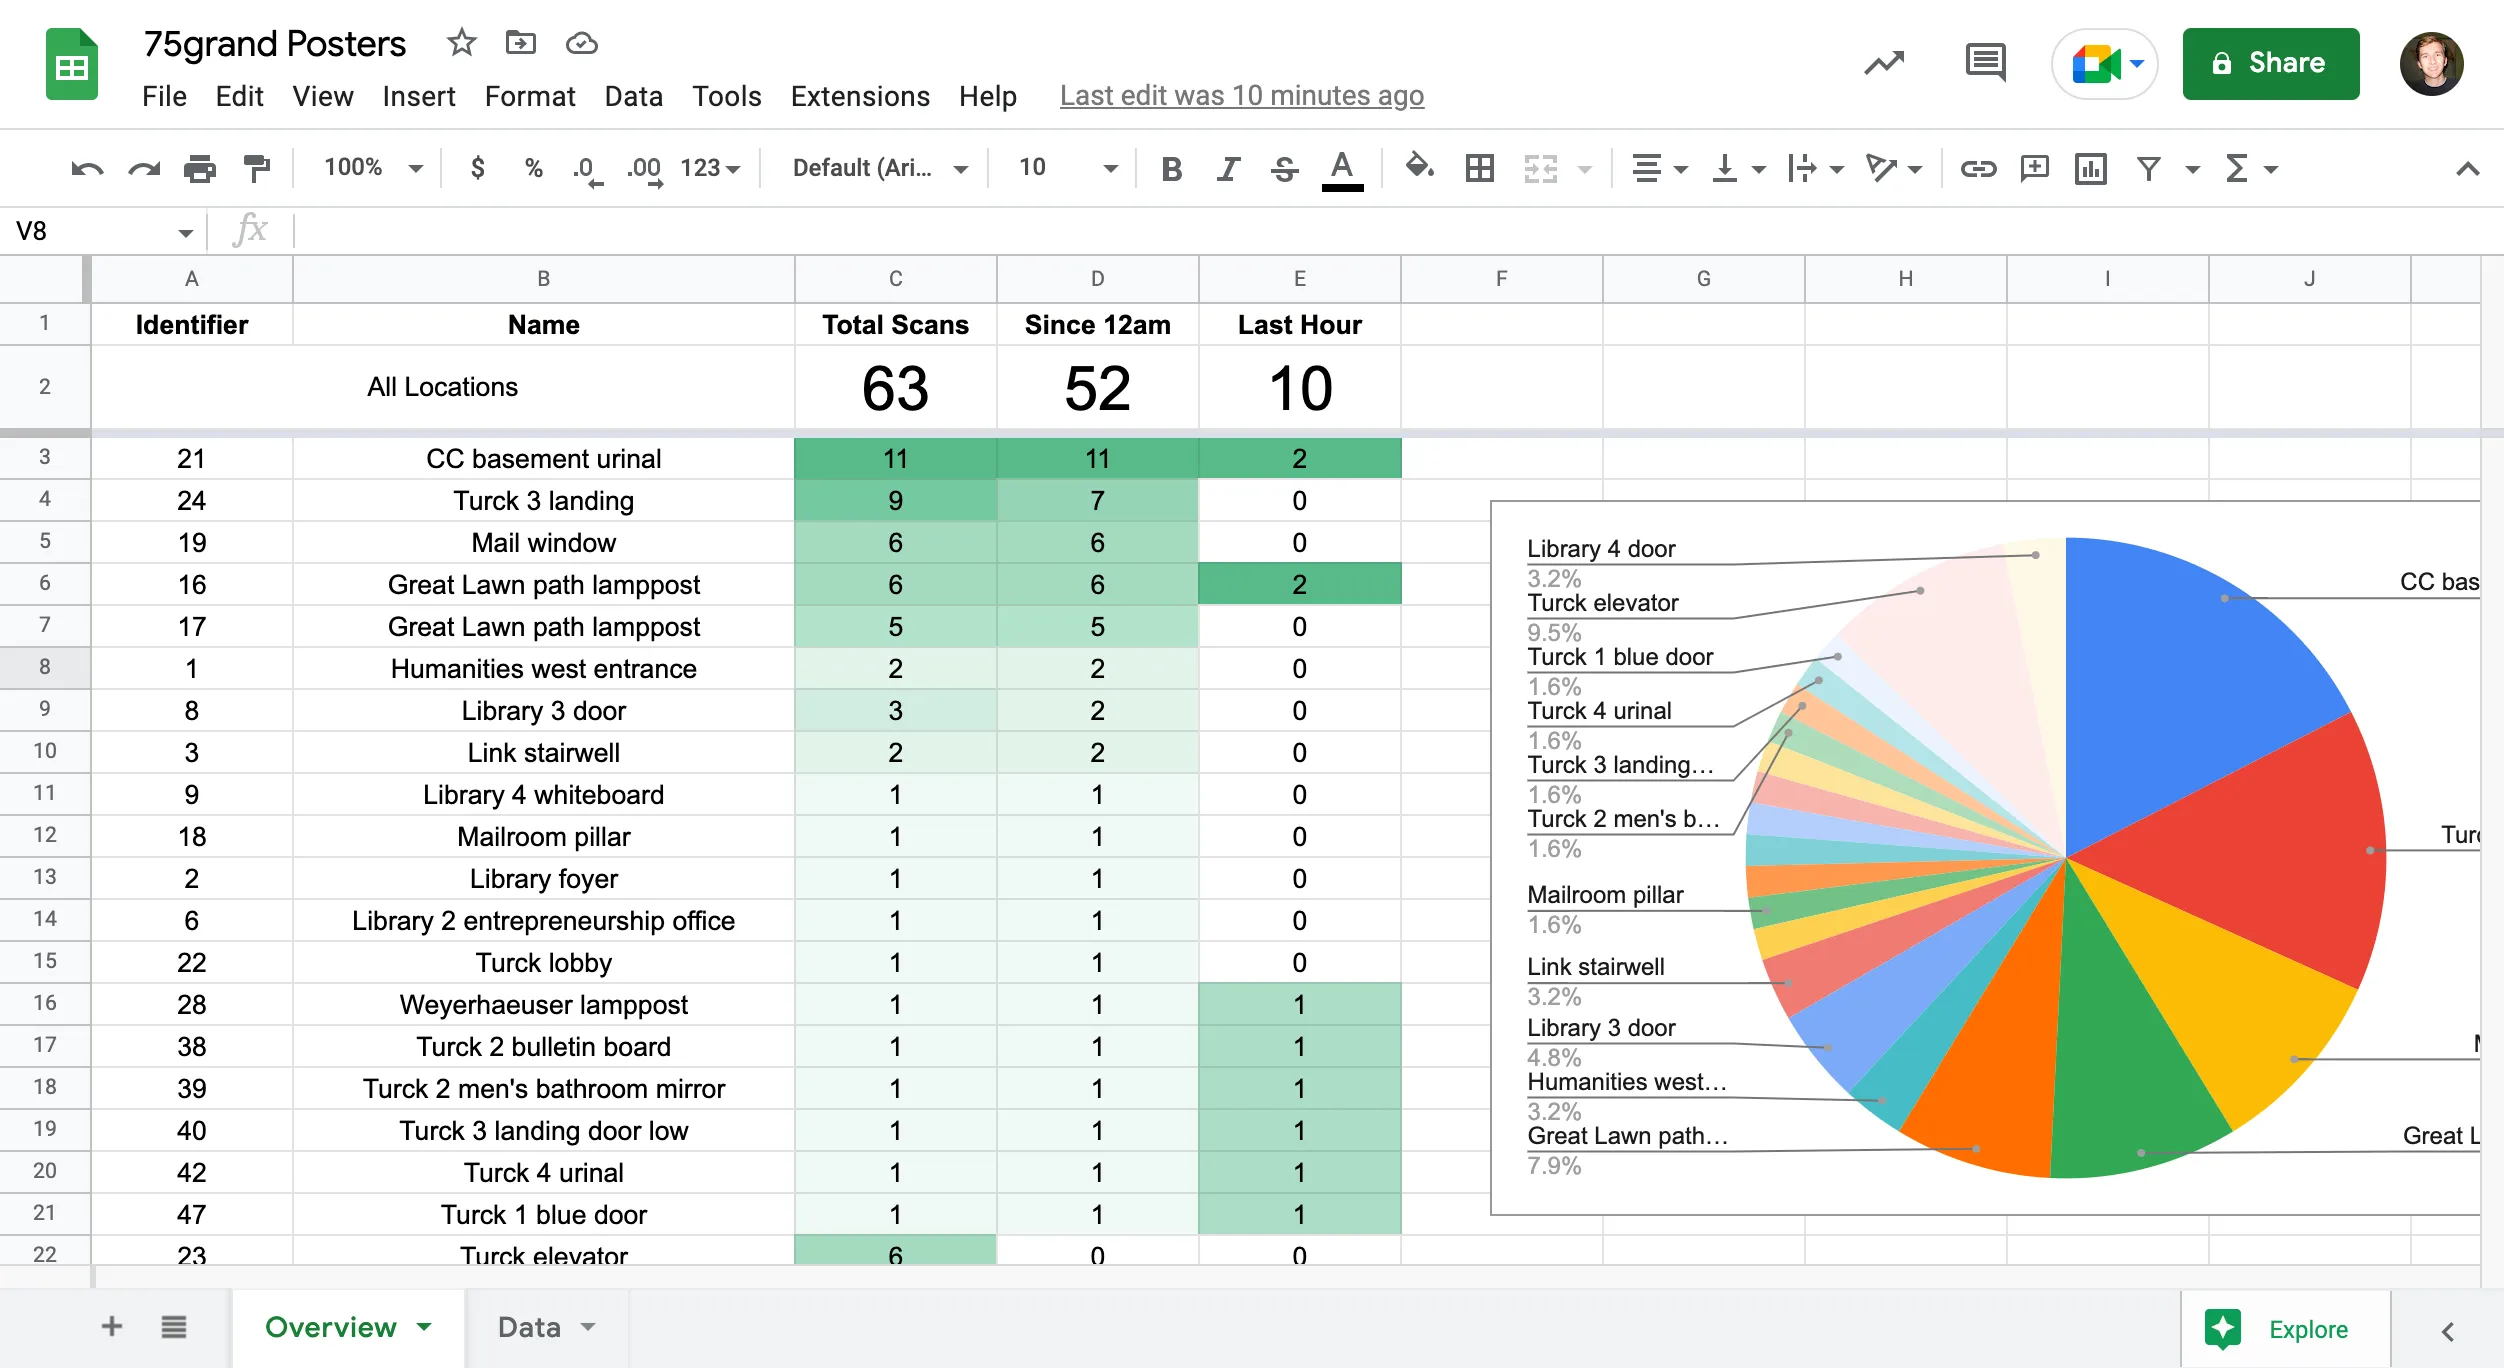
Where do people scan?
I hung 82 unique posters over the span of three days. They generated 429 total scans, as of about two weeks after my last round of poster-hanging. 75grand currently sees about 25–50 unique visitors every day, which I want to believe are a budding user base and not bots.
Here are the top five locations by number of scans.
| Location | Total Scans | Lifespan |
|---|---|---|
| Breezeway between two dorms | 39 | 144 hours |
| Residence hall door, facing out | 28 | 37 hours |
| Campus Center urinal | 27 | 133 hours |
| Mailroom, near pickup window | 23 | 190 hours |
| Campus green lampposts | 33 (combined) | 40–94 hours |
A poster’s lifespan is measured as the time between when it was placed and its last scan. I think I can safely assume that posters that haven’t been scanned in a few weeks are gone. (I also double-checked the ones in the table.)
The best connection I can find between the most popular locations is that they are in places when students aren’t in a hurry. Walking back to your dorm after class? Poster. Taking a piss? Poster. Waiting in line for your package? Poster.
Something I was surprised by is that my first round of posters was the most successful round. Subsequent rounds garnered fewer scans, even when they were placed more strategically or to replace popular posters that had been taken down.
How I created the posters
I wrote a simple HTML page with the design of the poster, which allowed me to easily change the QR code. Did you know you can use units like in and ft in CSS? To render the posters as PDFs, I glued together some JavaScript libraries that convert HTML to images and images to PDFs. It had lots of issues, but worked well enough. Each poster pointed to a slightly different URL. All the unique IDs were sequential, which made it easier to write down where each poster was located.
How I recorded the data
The backend was nice and simple. It was a single PHP file that logged the visit to an SQLite database and sent the visitor on their way. Adding a parameter to the URL dumped the database as CSV so I could play with it in Google Sheets using =IMPORTDATA().
I stored the poster’s ID, the timestamp, the visitor’s IP address, if the address was within a Macalester-owned IP range, and the user agent. I think that was about the extent of the data available to me without running over to the client side.
I’m glad I stored the user agent because there were a few interesting scans. On Monday, September 26 at 3:41pm, I received two requests from IPs owned by Tencent with the user agent python-requests/2.26.0. I’m guessing that someone scanned it using WeChat, except that the requests weren’t followed by a browser request. Does WeChat have a built-in (Python-based) proxy for its in-app browser? I’m also unsure why Tencent didn’t bother to change the user agent. I also saw a few scans from QR Scanner Android. Someone needs to learn they can just use their camera!
How I should have done it
- I should have generated the posters using Python or PHP, since both languages have very mature libraries for generating PDFs. It probably would have been much faster and more consistent—my posters didn’t always generate correctly thanks to browser rendering weirdness.
- I should have used random IDs for the QR codes. I detected a bit of tomfoolery, such as requests from desktop computers and requests to multiple IDs in a short timeframe, from the same device. An ID like
1YP8utpkdoesn’t invite that sort of thing. - I should have recruited someone to come along with me. I had to juggle a pen, tape, a piece of paper, and a folder full of posters, and a second person would have sped things up drastically.
- I should have taken more steps to ensure better experimental conditions. I have lots of questions, but I’m not sure that I can confidently answer them. I chose locations for posters on a whim and I’m pretty sure I didn’t collect enough data to make any definite conclusions—I don’t feel like dusting off my AP Statistics skills to try.
Epilogue
One night on a whim, I ventured up to the third floor of the humanities building—the land of IT services. I stumbled through the maze-like hallways, trying to keep track of each turn in search of a bulletin board. Encountering one, I hurriedly pinned up a poster and left without even securing the bottom. Days passed with no sign of life. Suddenly, on a windy September afternoon, a new row appeared on the spreadsheet. A single scan. Sixteen minutes later, a chime. A new email. Subject line: “75 Grand.” Let’s chat.